The previous record for the fastest rate of broken records is now broken.
The wettest winter on record for Washington.
The warmest February ever for the U.S.; except Washington, which had the coldest winter in 30 years.
Close to home: The most dirty laundry brought home by a college student to our house.
The most (seven) goals in the first two SHS boys soccer games of the season (two hat tricks in a row, plus one, by my neighbor).
But I digress.
I, too, have had enough of this cold and wet winter, and I’m not even a gardener. But March is on track to continue February’s trend.
March is notorious for “anything’s possible” from warm sun to rain-on-snow in a given day or hour. When this article is published, the Spring Equinox will have just passed with little warming — perhaps another record is about to be broken.
On yet another scale
Carbon dioxide levels in our atmosphere rose at a record pace for the second straight year.
The average pH of the ocean is increasingly acidic due to increased absorption of carbon dioxide.
The global average temperature was highest ever for the third year in a row.
Polar sea ice is declining with an accelerating trend. Global average sea level continues to rise.
Finally, glaciers, especially in the Olympics, are disappearing despite periodic gains.
Now I’m sounding like a broken record.
Alas, all these trends and more follow from the first one. All are based on long-term monitoring initially conducted by a variety of researchers from different countries, but integrated into the work of NASA and NOAA as global trends became apparent and global consistency became essential.
At the moment, many scientists, satellites, models and other resources utilized by these two federal agencies (and anyone needing good weather forecasts or projections of future conditions) are in line for the budget guillotine.
Some claim that millions of people have fallen for a conspiracy hoax. That’s wishful thinking. The time for skepticism and debate about global warming was, literally, last century. In fact, two centuries ago cyclical paleoclimates were first recognized, providing the backdrop against which the unusual rise in greenhouse gases was easily recognizable by the middle of the last century.
By the 1970s, climate science had the attention of risk managers involved in national security and the health, agriculture, property insurance and energy industries, at least. Something big was happening, and faster than expected. Regulations emerged to limit acid rain and ozone depletion but by the 1990s push-back was heavy from business coalitions with access to power in the U.S.
The uncertainties expressed by scientists, standard practice in the legal and medical professions as well, were twisted into doubt.
The environment and people’s health, property and financial well-being are affected across the globe by climate change to varying degrees. I am sure most people would like to wish it away. Wish the data weren’t true and the science weren’t real.
But not having data doesn’t mean the risk goes away.
As a mom, I’ve had enough. As a scientist, I’ve seen enough broken records to know we can’t waste time on wishing.
NASA is the National Aeronautical and Space Agency; NOAA is the National Oceanic and Atmospheric Administration in the US Dept. of Commerce.
For more information, see the websites for these agencies: global-change.org, and the World Meteorological Organization’s at IPCC.ch (Intergovernmental Panel on Climate Change).
Geek Moment
“Rain-on-snow event” = a storm that’s pretty much how it sounds. Fairly common in our region because of our latitude and the elevation of the Olympics and Cascades. These events are most destructive when a fresh accumulation of snow is followed by a warmer storm, the rain quickly erodes the snow and extreme runoff volumes cause flooding.
For the 2017 water year (started Oct. 1), on March 20:
• In Sequim, cumulative rainfall = 9.95 inches
• At the SNOTEL station (elev. 4,000 feet), snowpack = 22 inches; snow water equivalent = 9.3 inches (130 percent of the median). Days+nights below freezing = 27
• Dungeness River at Mile 11.8, flow = 750 cfs, dropping after a storm. Bell Creek flow at North Blake Avenue = about 0.3 cfs; at the mouth = 5+ cfs (1 cfs is just under 650,000 gallons per day)
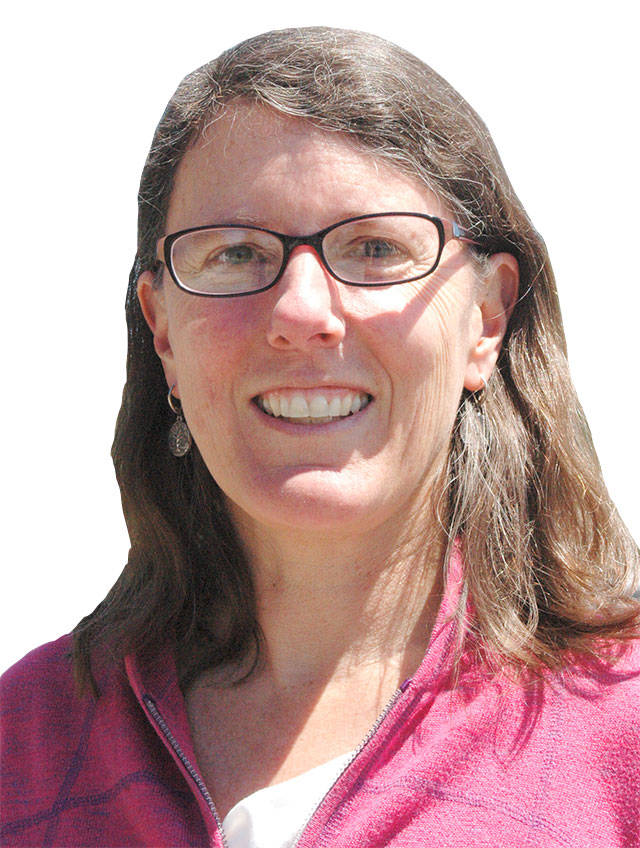
Ann Soule is a licensed hydrogeologist immersed in the Dungeness watershed since 1990. She is now the resource manager for the City of Sequim. Reach Soule at columnists@sequimgazette.com or via her blog of Gazette articles at watercolumnsite.wordpress.com.


